Institutional Insights: Deutsche Bank Flows & Positioning 22/6/26

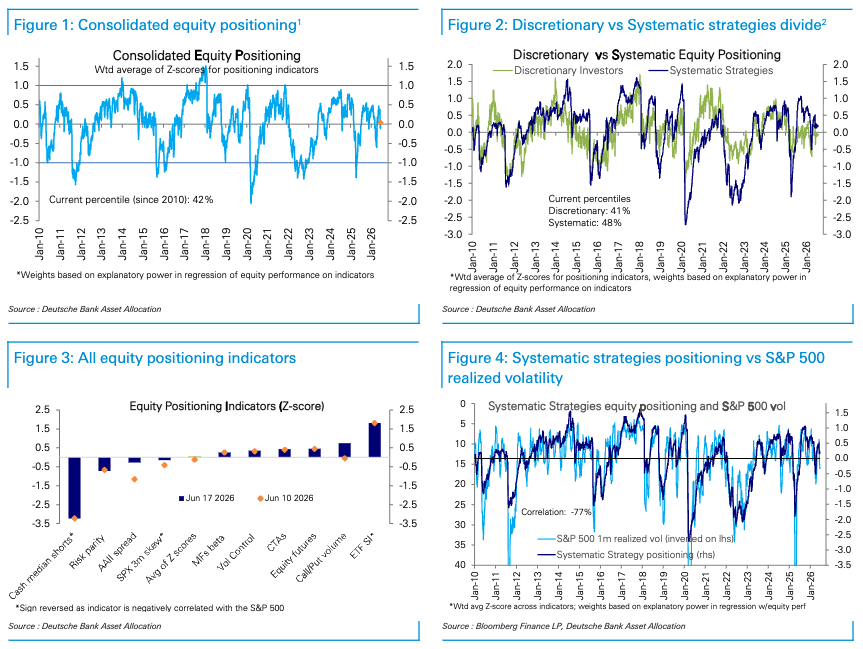
Equity positioning has bounced back quickly after last week’s sharp, narrow unwind, moving from modestly underweight to slightly above neutral at 0.05 standard deviations, or the 42nd percentile. That is not stretched, but it does show that investors have re-risked into the bounce. The broader market has still gone largely sideways over the last month, which fits the idea that the two biggest rally catalysts have paused: the Iran war resolution has largely been priced, and the extreme earnings-upgrade impulse has cooled. The result is a market with decent demand but less obvious upside catalyst, leaving it vulnerable to choppier factor rotation.
The positioning split is balanced. Discretionary investor positioning is close to neutral but still slightly below, at -0.07 standard deviations and the 41st percentile. Systematic strategies remain modestly overweight at 0.19 standard deviations and the 48th percentile. Large-cap equity positioning has moved to modestly overweight at 0.13 standard deviations and the 49th percentile, driven by large-cap Tech at 0.21 standard deviations and the 63rd percentile. Small caps are also slightly above neutral at 0.10 standard deviations and the 54th percentile. This is not a euphoric aggregate positioning picture, but it is no longer a clean under-owned market either.
Equity fund inflows are on track to post a record week, confirming strong continued demand for equities. That said, the seasonal caveat matters because this week of the year typically sees very strong inflows. The inflow data confirm that the market still has sponsorship, but they should not be overread as a fresh signal of extreme conviction. The better read is that investors are willing to allocate to equities, but the index-level story remains more sideways and dependent on factor leadership.
Options activity looks more aggressive. The 5-day moving average of the call-to-put volume ratio jumped to the 79th percentile, driven by broad-based increases in net call volume across single stocks, index options, and ETF options. Within single-stock options, volumes rose in Financials, Mega-Cap Growth and Tech, and Consumer Cyclicals, while other sectors saw limited change. This fits the recent tape: investors are adding upside convexity after the rebound, particularly in Tech and cyclicals, but that also means some of the short-term chase has returned.
The fact that S&P 500 3-month 90%-110% skew rose this week is interesting. It suggests that even as call volume picked up and sentiment improved, investors still value downside or asymmetric protection. This is consistent with a market that is participating in upside but remains aware of macro event risk, Warsh’s hawkish Fed debut, thin liquidity, and the potential for AI-related disappointments. The market is not simply all-in bullish; it is adding upside while still paying attention to tails.
Sentiment improved but remains bearish. The bull-minus-bear spread turned less bearish but is still only in the 10th percentile and has been bearish for five consecutive weeks. Bullish responses rose to the 47th percentile, neutral responses rose to the 21st percentile, and bearish responses fell but remain high at the 80th percentile. This is a supportive contrarian setup in the sense that sentiment is not euphoric at the survey level, even though options activity and retail pockets may look more speculative. The institutional mood remains cautious.
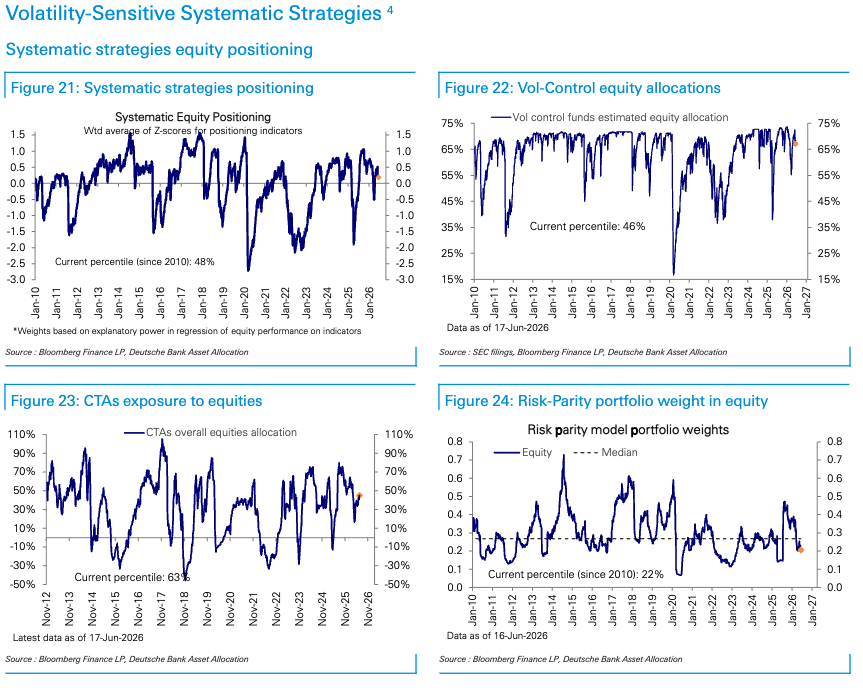
Vol-control funds are not a major downside threat right now. Their equity allocation remains moderate at the 46th percentile, and their sensitivity to market selloffs declined this week. With exposure no longer stretched and sensitivity lower, vol-control funds have room to add equities, while near-term forced-selling pressure appears more limited. That is important because one of the risks in a low-liquidity summer tape is systematic selling amplification. For now, vol-control positioning does not look like a major source of immediate downside pressure.
CTAs have raised equity positioning to the upper half of their historical range at the 63rd percentile. Their exposure is broad-based across regions, led by Europe at the 74th percentile, followed by the US at the 62nd percentile and EM at the 61st percentile, while Japan remains more modest at the 47th percentile. This means CTAs are no longer a major under-owned upside catalyst; they have already moved into a constructive equity stance. If trends continue, they can add, but the easy CTA re-risking impulse may be less powerful from here.
CTA positioning outside equities reinforces the macro sensitivity. Short positioning in bonds increased further, with US bonds at the 13th percentile and Europe at the 15th percentile, while dollar longs remain elevated at the 90th percentile. That fits the post-Warsh world: more hawkish Fed interpretation, higher front-end policy uncertainty, and stronger dollar bias. In commodities, CTA gold longs are moderate at the 44th percentile, copper longs are very high at the 94th percentile, and oil longs rose slightly to the 65th percentile. The high copper positioning is a notable cyclical/AI infrastructure risk if global growth or China disappoints.
Risk parity funds remain a potential source of future equity demand. They raised equity allocations modestly but still sit low at the 22nd percentile, with moderate US exposure at the 22nd percentile, other developed markets at the 38th percentile, and EM at the 12th percentile. Across asset classes, bond exposure increased to the 67th percentile, while inflation-linked securities and commodities remain elevated at the 86th and 92nd percentiles, respectively. This suggests risk parity is still positioned cautiously on equities but remains heavily allocated to inflation-sensitive assets.
Sector positioning is one of the most useful parts of the data. Mega-Cap Growth and Tech broadly sits near neutral at -0.01 standard deviations and the 48th percentile, while Energy is also near neutral at -0.02 standard deviations and the 62nd percentile. But large-cap Tech specifically has edged up to modestly overweight at 0.21 standard deviations and the 63rd percentile. That distinction matters: the broader MCG/Tech complex is not extremely crowded by this measure, but large-cap Tech has become more owned again after the rebound.
The bigger opportunity may be in under-owned cyclicals. Consumer Cyclicals are underweight at -0.54 standard deviations and the 25th percentile, Industrial Cyclicals are more deeply underweight at -0.75 standard deviations and the 12th percentile, and Financials are very underweight at -0.92 standard deviations and the 8th percentile. Materials are at an extreme underweight of -1.40 standard deviations and the 0th percentile. If the broadening trade continues, these under-owned cyclicals have substantial positioning room to catch up, especially if lower oil, stable yields, and resilient growth persist.
Financials remain particularly interesting. They have seen signs of buying in recent flow data, but positioning is still only in the 8th percentile. That means recent demand has not yet made the sector crowded. If Warsh’s Fed keeps the curve flatter, that could complicate the bank story, but parts of Financials such as payments, consumer finance, capital markets, and insurers may still benefit from stronger risk appetite, credit stability, and broadening. The key is whether rates volatility stays controlled.
Materials at the 0th percentile is the most extreme positioning signal. That underweight may reflect China weakness, global manufacturing skepticism, and uncertainty around commodity demand. It also makes the sector a potential contrarian catch-up candidate if China stabilizes, infrastructure demand improves, or AI-related power/grid/copper demand continues to broaden. However, with copper positioning already very long among CTAs, the Materials equity underweight is not a simple “everyone is short commodities” story. Investors may like the commodity but not the equity operating leverage.
Defensive positioning is mixed. Real Estate declined this week but remains overweight at 0.31 standard deviations and the 79th percentile. Utilities were trimmed to just above neutral at 0.07 standard deviations and the 57th percentile, while Consumer Staples rose to neutral at 0.04 standard deviations and the 54th percentile. Healthcare declined sharply to underweight at -0.36 standard deviations and the 33rd percentile. This suggests investors are not broadly hiding in defensives; instead, they are selectively positioned in rate-sensitive Real Estate while Healthcare has been de-risked.
Healthcare’s move to underweight is notable because earlier desk flows showed demand for the sector as part of the broadening trade. The positioning data suggest that any recent buying has not yet rebuilt exposure. That could leave room for catch-up if the sector gets an earnings or policy catalyst, especially given its defensive growth characteristics. But it also reflects ongoing uncertainty around pharma, biotech, regulation, and relative earnings momentum versus AI and cyclicals.
The overall message is that the market is no longer under-positioned, but it is not stretched at the aggregate level. The risk is more about pockets of crowding and leverage than broad equity exposure. Large-cap Tech, Semis, AI infrastructure, call-option activity, and certain systematic flows are where positioning and volatility risks are concentrated. Meanwhile, many non-Tech cyclicals remain significantly under-owned, which supports the broadening thesis if macro conditions cooperate.
Disclaimer: The material provided is for information purposes only and should not be considered as investment advice. The views, information, or opinions expressed in the text belong solely to the author, and not to the author’s employer, organization, committee or other group or individual or company.
Past performance is not indicative of future results.
High Risk Warning: CFDs are complex instruments and come with a high risk of losing money rapidly due to leverage. 71% and 74% of retail investor accounts lose money when trading CFDs with Tickmill UK Ltd and Tickmill Europe Ltd respectively. You should consider whether you understand how CFDs work and whether you can afford to take the high risk of losing your money.
Futures and Options: Trading futures and options on margin carries a high degree of risk and may result in losses exceeding your initial investment. These products are not suitable for all investors. Ensure you fully understand the risks and take appropriate care to manage your risk.
Patrick has been involved in the financial markets for well over a decade as a self-educated professional trader and money manager. Flitting between the roles of market commentator, analyst and mentor, Patrick has improved the technical skills and psychological stance of literally hundreds of traders – coaching them to become savvy market operators!