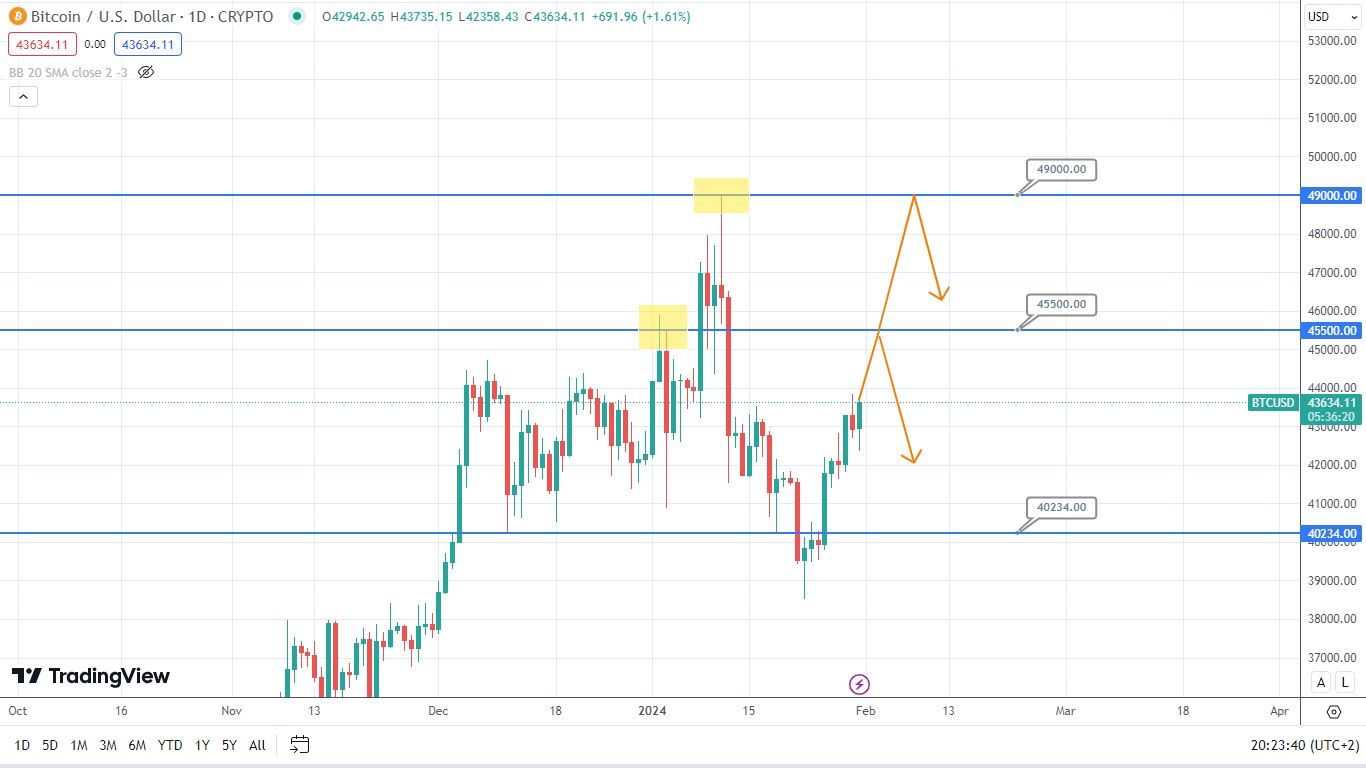
Bitcoin Analysis: Potential Price Rise Ahead

The price of Bitcoin is heading up. However, the asset will have to face resistance at two levels: 45500 and 49000. The asset’s price might potentially rebound from these levels and drop. Yet it would be wise to follow the candlestick formations to forecast what is about to come next. Should the price of Bitcoin break the resistance level of 49000, it might either rise or form a bullish trap. So, let’s observe which scenario might work out.
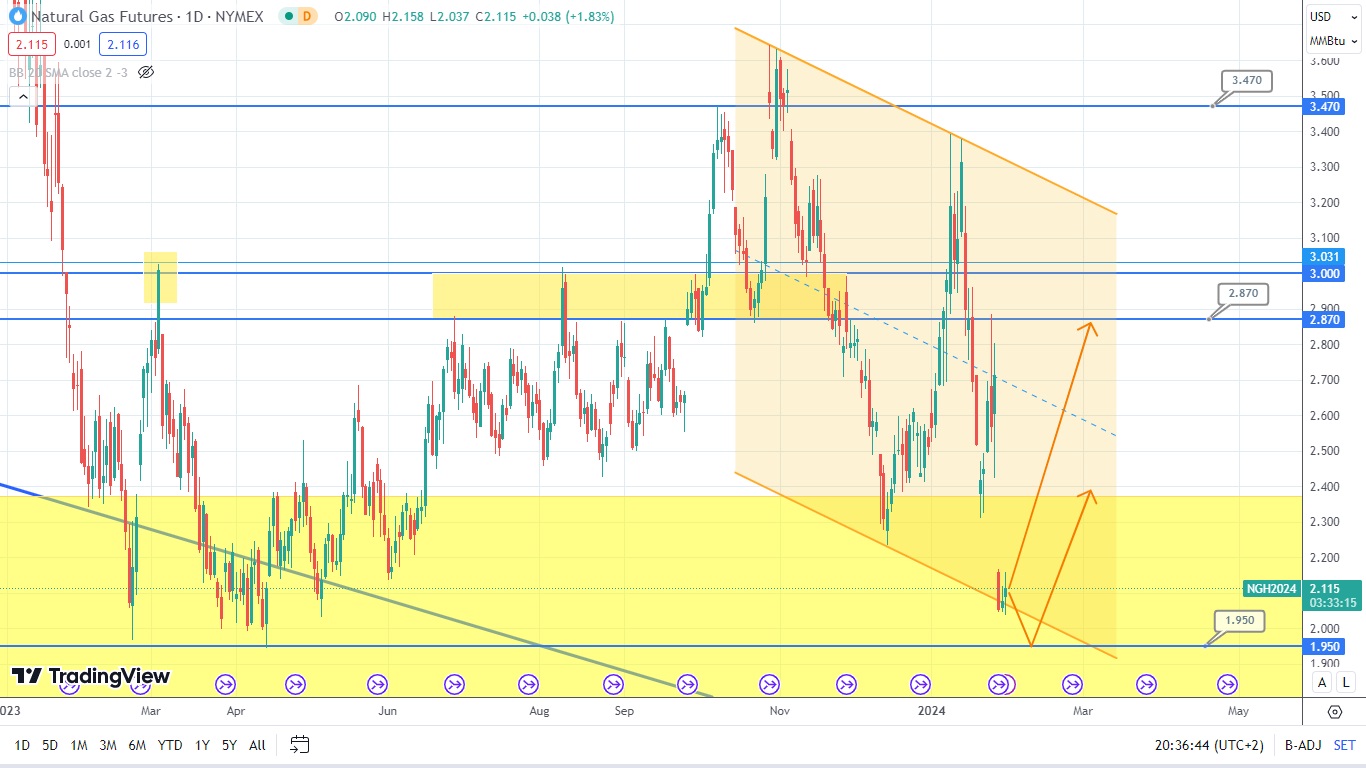
The price of natural gas (this asset is referred to as NAT.GAS in the Tickmill’s trading terminal) keeps moving next to the minimum point around the level of 1.95. The price of this asset might rebound from the downtrend, rise, and hit the level of 2.87. It could also rebound from a very important supporting level of 1.95, although the candlestick formations point out that the first scenario is likely to work out. So, let’s observe what might happen next.
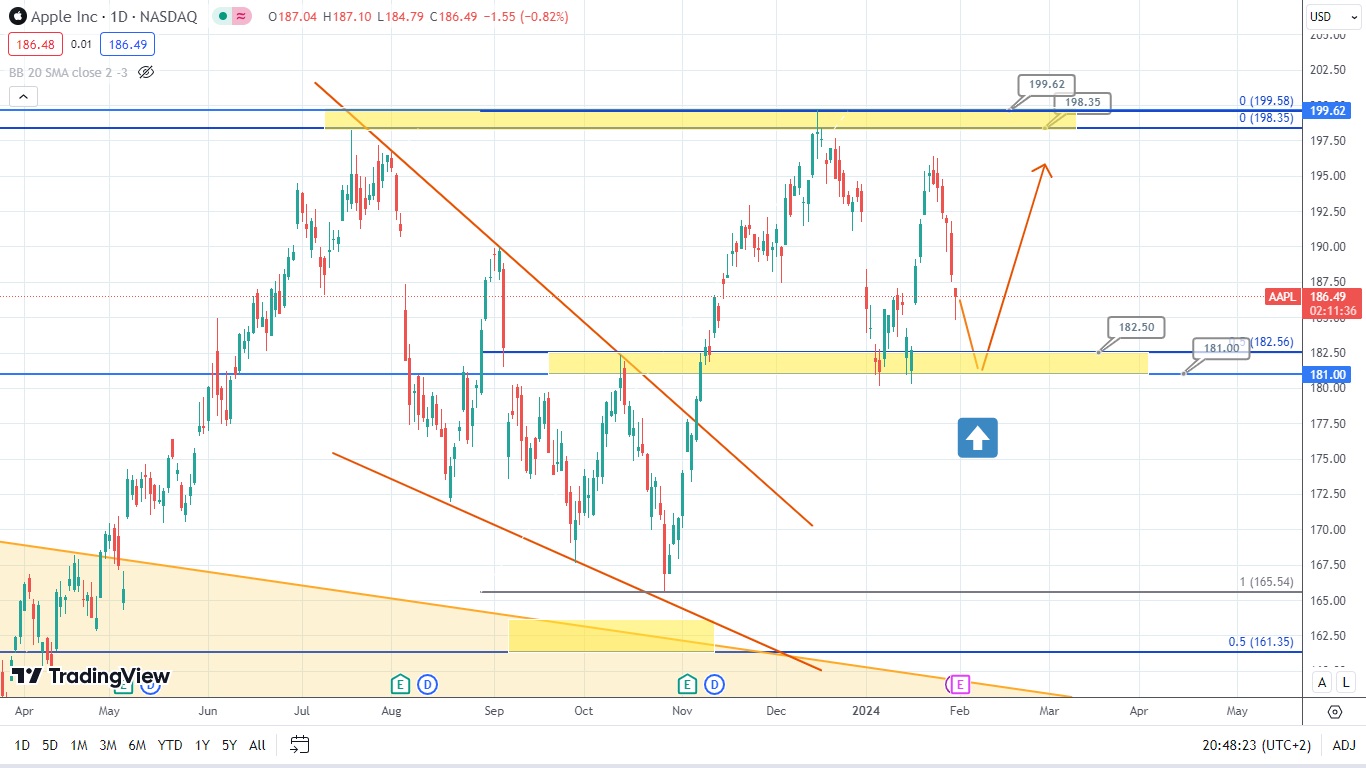
The price of Apple stocks (this asset is referred to as AAPL in the Tickmill’s trading terminal) has failed to approach the resistance zone formed between two maximum points, rebounded, and dropped. The asset might try to gain the required support in the zone formed between levels 181 and 182.50, rebound, and rise. In this case, it would be wise to follow candlestick formations, as they might forecast the next price move.
Disclaimer: The material provided is for information purposes only and should not be considered as investment advice. The views, information, or opinions expressed in the text belong solely to the author, and not to the author’s employer, organization, committee or other group or individual or company.
Past performance is not indicative of future results.
High Risk Warning: CFDs are complex instruments and come with a high risk of losing money rapidly due to leverage. 69% and 73% of retail investor accounts lose money when trading CFDs with Tickmill UK Ltd and Tickmill Europe Ltd respectively. You should consider whether you understand how CFDs work and whether you can afford to take the high risk of losing your money.
Futures and Options: Trading futures and options on margin carries a high degree of risk and may result in losses exceeding your initial investment. These products are not suitable for all investors. Ensure you fully understand the risks and take appropriate care to manage your risk.